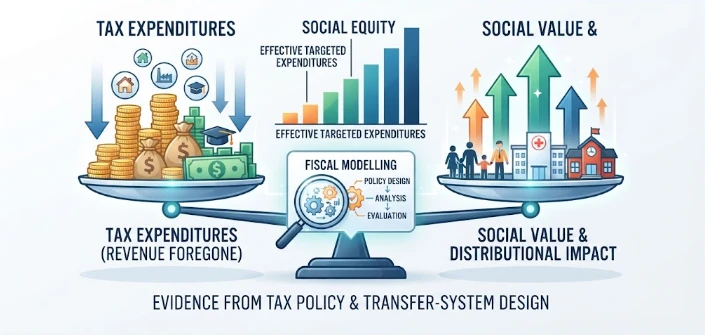
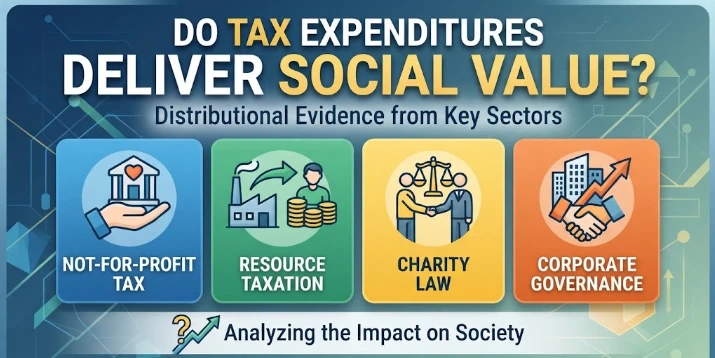
This article evaluates tax expenditures as public interventions whose social value should be tested as carefully as direct government spending. It explains that deductions, exemptions, credits and preferential rules are measured against a benchmark tax system, so the choice of counterfactual shapes the apparent fiscal cost. Distributional analysis is essential because deductions may be worth more to higher-rate taxpayers, while non-refundable credits can provide little immediate support to households with low tax liabilities. Fiscal modelling, including microsimulation, can show how concessions interact with means-tested transfers, effective marginal tax rates, family structure and labour-market incentives. The article distinguishes static revenue estimates from behavioural responses and argues that any concession should be compared with realistic alternatives such as targeted transfers, grants, public services or neutral rate reductions. It also highlights administrative burden, take-up, uncertainty, lifetime incidence and governance. Regular reporting, clear objectives, sunset dates and scheduled evaluation can reveal whether a concession reaches intended groups, changes behaviour and remains defensible after cost, distribution and complexity are considered together.
The OECD policy areas on inequality budgeting have shifted the focus of the distributional analysis towards the centre of fiscal policy decisions. The microsimulation models are able to integrate tax, transfer, survey, and administrative data to answer questions of how policy impacts different income groups and who wins and loses. That is significant as the tax concession is in the statute book may seem cheap but may become very costly when the take up grows. It also reveals whether the concession serves to bring benefits to the people who are identified as the social problem of the concession or only provides benefits to activities that would have taken place anyway.
The first principle of fiscal modelling is to agree on the counterfactual. Measuring the cost of a tax expenditure involves using a benchmark, and the choice of benchmark can make a huge difference in what the apparent cost is. An additional complication is the design of concession transfers, which can also affect the entitlement to benefits based on income or assets. Before interpreting any distributional result, it is important to document the benchmark, the unit of analysis, the behavioural assumptions, the data year and treatment of transfers in the model documentation.
The incidence of a tax is not always as easy to see as it sounds on paper. Deductions can provide proportionately higher absolute benefits at higher tax rates while non-refundable credits can go through households with low tax liabilities. Also, the value of concessions that are linked to property, retirement saving, investment or business structures may also build up over the years. A credible social-value test would require an analysis of who can access the provision, the fiscal value to each group and the access based on professional advice or asset ownership.
Fiscal modelling is particularly useful in situations where tax expenditures are coupled with rules of transfer withdrawal. Marginal rates of taxation can vary significantly from headline rates because of the impact on the entitlement to means-tested support that can come with a concession that increases the disposable income of the recipient. The New Zealand Treasury's TAWA framework is an excellent example of how modelling tax and welfare issues together can be of benefit, rather than within their own 'silos'. The kind of modelling can highlight such things as cliffs, plateaus and overlapping incentives that can be obscured by normal budget tables.
There should be a distinction between the effect that the evaluation has on the cost and the behavioural response. Typically, the revenue forgone estimates assume that the concession remains and is removed, which may alter saving, investment, labour supply, pricing, or organisation. It doesn't detract from the value of static estimates, only adds a degree of rigour to interpretation. A strong review ensures that static fiscal cost is placed alongside behavioural evidence, incidence of the costs, administrative burden, and plausible alternative courses of action and allows decision makers to consider value; not just one cost estimate.
In order to have an alternative-policy question, it is necessary to have a policy question. A broad tax concession can be likened to a targeted transfer, direct grant, public service, refundable credit, or a neutral-rate reduction, all of which are paid for from the same budget. The take-up patterns, administrative requirements and political visibility vary between the instruments. Social value is more apparent when the measure is not all-or-nothing between continuation and abolition, but rather continuation and the most effective application of the same financial resources.
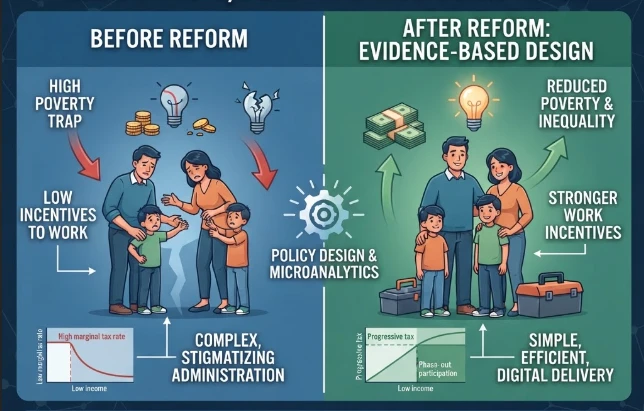
Care needs to be taken when considering labour-market effects. Changes in employment-related reliefs, reliefs for childcare, or changes in saving for retirement can affect the return to working more, but this response is dependent on the family structure and transfer rules. An effective marginal rate that is high may occur with the presence of a combination of the income tax, social contributions and benefit withdrawal. Distributional modelling can reveal the areas and separate a real work-incentive increase from a simple headline-rate increase with little effect on net disposable income.
A social-value score card that can be useful for comparing is a comparison of cost per beneficiary, a share of value reaching target groups, behavioural additionality, administrative burden, and interaction with poverty or work incentives. The distributional layer is provided by microsimulation, and the programme evaluation helps to determine if behaviour actually changed. That is more powerful than people taking the view that if they take it, then it will work. When a concession is taken up, it can simply mean that it's generous, familiar, or easy to claim.
Evaluation is influenced by governance quality, which will in turn influence policy changes. Costs of tax expenditures are not easily apparent and because those who gain from past concessions coalesce around them, they tend to remain. The inertia can be overcome by regular publication, clear stated goals, responsible named agencies, expiration dates and evaluation schedules. Reports which specify intended beneficiaries, actual incidence, uncertainty ranges and evidence on behavioural additionality make parliamentary scrutiny more meaningful.
Social value can be achieved by administrative simplicity. A technically accurate concession may be ineffective when the eligibility requirements require records, valuations, elections, or even expertise that the recipients are not able to provide. Complexity also poses enforcement challenges and inequity. The design quality of the tax also encompasses the burden of the filing, the risk of error, certainty, and the likelihood of better resourced taxpayers benefiting disproportionately through planning as opposed to the tax activity that the policy is focused on.
Equity analysis is to be done more than on an annual income basis. The apparent distribution of a concession may also change because of lifetime income, family structure, geography, disability, exposure to housing costs and age. An obvious example is retirement incentives as current tax relief can result in benefits decades later. Another concern is resource-tax concessions as fiscal value may vary with cyclical changes in commodity prices. A wide lens is so wide that annual cash-flow analysis is not confused for a full social assessment.
The other part of good fiscal modelling is the expression of uncertainty. Forecasts are subject to the effects of take-up, economic parameters, elasticities, data quality and type of tax system selected. Ranges and sensitivity testing can help build trust since uncertainty is now apparent instead of hidden in technical assumptions. That practice is more critical when large concessions are only being defended on the basis of predicted investment or growth effects which cannot be separated from general economic trends.
Tax expenditure reporting also has grown beyond simply being a narrow accounting exercise to being a tool of transparency. The Tax Expenditures and Insights Statement approach to ‘concessions’ in Australia considers them to be a departure from a benchmark and works out estimated revenue loss under the current policy landscape. The statistics of reliefs in the United Kingdom are also divided into two groups: structural and closer examination. In all those systems, the obvious takeaway is that preferential tax treatment is worthy of the same kind of scrutiny as direct expenditures, since both represent a use of limited fiscal resources.
The first step in a durable reform process is inventory and the last step is comparison. For each concession, it is important to set clear goals, develop measurable indicators, analyse distribution, evaluate administration, and define a date for re-evaluation. Good provisions can be kept, bad provisions can be redesigned, capped, converted or removed. The goal isn't against tax expenditures, it's equal treatment of all kinds of public assistance.
The real question is: is a reform still defensible when the fiscal costs, distribution, complexity and uncertainty are put on the same page? Good design, then, includes transparency as a component of the policy design process, not a communications piece after the design has been put in place. One benefit of this is that all the hidden trade-offs in a process become apparent before thresholds, exemptions, or enforcement settings become entrenched in the routine. The second implication is that the design of a fiscal policy should be judged based on observed behaviour, not by statutory definition.
This is important as a distinction since legal form and economic incidence may go in different directions after adjustment. An additional protection is to make the assumptions explicit so that other analysts can either reproduce or debunk the main result. The stronger evidence can be gained where distribution, administration and behaviour are analysed collectively as opposed to individually in reports. Agreements over evaluation criteria increase the durability of the policy when beneficiaries and administrators adjust to a permanent policy.
The real question is: Is a reform defensible when the fiscal cost and its impact on distribution, complexity and uncertainty are put on the same page? Transparency is therefore an integral aspect of policy design and not a communication project post-design. Another benefit of this is that avoiding thresholds, exemptions, or enforcement settings becomes apparent before they become a habit.
CITE THIS ARTICLE
Sultana, K. R. (2026). Do Tax Expenditures Deliver Social Value? Distributional Evidence from Tax policy, fiscal modelling, tax expenditures, transfer-system design. https://researchbysultana.com/article/6143f0c4-eed2-5a97-ad49-db8b96b94d7d
K. R. Sultana, “Do Tax Expenditures Deliver Social Value? Distributional Evidence from Tax policy, fiscal modelling, tax expenditures, transfer-system design,” 2026. [Online]. Available: https://researchbysultana.com/article/6143f0c4-eed2-5a97-ad49-db8b96b94d7d
Sultana, K. R. (2026) ‘Do Tax Expenditures Deliver Social Value? Distributional Evidence from Tax policy, fiscal modelling, tax expenditures, transfer-system design’. Available at: https://researchbysultana.com/article/6143f0c4-eed2-5a97-ad49-db8b96b94d7d
Sultana, Kazi Rukaiya. “Do Tax Expenditures Deliver Social Value? Distributional Evidence from Tax policy, fiscal modelling, tax expenditures, transfer-system design.” 2026, https://researchbysultana.com/article/6143f0c4-eed2-5a97-ad49-db8b96b94d7d.
Kazi Rukaiya Sultana. “Do Tax Expenditures Deliver Social Value? Distributional Evidence from Tax policy, fiscal modelling, tax expenditures, transfer-system design.” (2026). https://researchbysultana.com/article/6143f0c4-eed2-5a97-ad49-db8b96b94d7d.
Sultana KR. Do Tax Expenditures Deliver Social Value? Distributional Evidence from Tax policy, fiscal modelling, tax expenditures, transfer-system design. 2026. https://researchbysultana.com/article/6143f0c4-eed2-5a97-ad49-db8b96b94d7d
@misc{article_6143f0c4eed25a97ad49db8b96b94d7d,
  title = {Do Tax Expenditures Deliver Social Value? Distributional Evidence from Tax policy, fiscal modelling, tax expenditures, transfer-system design},
  author = {Kazi Rukaiya Sultana},
  year = {2026},
  url = {https://researchbysultana.com/article/6143f0c4-eed2-5a97-ad49-db8b96b94d7d},
}
TY  - GEN
AU  - Kazi Rukaiya Sultana
TI  - Do Tax Expenditures Deliver Social Value? Distributional Evidence from Tax policy, fiscal modelling, tax expenditures, transfer-system design
PY  - 2026-04-01
UR  - https://researchbysultana.com/article/6143f0c4-eed2-5a97-ad49-db8b96b94d7d
ER  -
This article uses institutional economics and applied microeconomics to show why tax-transfer reform cannot be evaluated from policy rules alone. Household disposable income reflects earnings, taxes, contributions, benefits, housing support and withdrawal schedules, but the effectiveness of those rules also depends on institutions that administer them. Different data systems, delayed appeals, inconsistent local delivery and administrative capacity can cause a theoretically efficient policy to wo
This article presents tax transparency as a governance and accounting issue rather than a simple disclosure exercise. Boards oversee tax outcomes that are influenced by risk appetite, capital allocation, internal controls, remuneration and significant transactions, while accounting systems provide the common record connecting financial profit, taxable income, deferred tax, cash tax and uncertain positions. IFRS S1 and IFRS S2 are used to show how sustainability-related financial information can
This article evaluates tax expenditures in not-for-profit, charity and resource-tax settings through distribution, governance and public value. Preferential treatment for charities and similar organisations is justified by public or community benefit, so reporting and governance should show whether concessions expand valued services, improve access or instead accumulate as private or organisational advantage. The article warns that annual income alone is an incomplete equity measure because life